Sunday, July 17, 2011
Unstandardized choropleth map
http://www.injusticeeverywhere.com/?p=3333
Unstandardized choropleth maps show numerical data sets. Rather than average the numbers, they all are represented as raw, unadjusted values. Color coding is used to differentiate between sets.
This unstandardized choropleth map shows the 2010 Q3 NPMSRP County-Level Police Misconduct Incidents across the United States.
Nominal area choropleth map
http://my.ilstu.edu/~jrcarter/Geo204/Choro/Tom/
Nominal area choropleth maps are choropleth maps that display nominal data (data that is qualitative, categorical, and classified into groups, with no implicit ordering). Examples of nominal data include hair or eye color, race, ethnicity, religion, etc.
This nominal area choropleth map shows the percent of persons who are Hispanic or Latino (of any race) for Florida, by county. This was taken from the 2000 Census.
Standardized choropleth map
http://www.ij-healthgeographics.com/content/3/1/18/figure/F6
Standardized choropleth maps are those that have been areally averaged (as opposed to unstandardized choropleth maps, which have not been areally averaged). When the numbers have been averaged, the data is then compared (usually by seeing how it is distribution over a specific area). The data is standardized because it is represented as ratios, percentages, rates, decimals, etc.
This is a standardized choropleth map of Bayesian smoothed prevalences in Lower Saxony.
Unclassed choropleth map
http://www.agocg.ac.uk/reports/visual/casestud/dykes/issue3_1.htm
Unclassed choropleth maps are looked at by the majority of cartographers skeptically, because they do not have any data sets to really rely on. Color shadings are used to classify the data, and this is done in proportion to the data values. A color therefore represents a certain data value or range, but there is really no other indicator or clue that helps us in determining what that value actually is. Therefore, unclassed choropleth maps are generally avoided.
This unclassed choropleth map shows the proportion of children ages 0-15. Five unknown classes are used, based on an equal bin interval classification scheme.
Classed choropleth map
http://personal.uncc.edu/lagaro/cwg/color/Choropleth-5Good.gif
A classed choropleth map shows varying statistics that occur within specific boundaries. It follows a pattern of spatial organization of information, without showing trends particular to that information. Rather than use specific, raw data, classed choropleth maps use numerical averages to portray information.
This classed choropleth map shows per pupil expenditure for public education in North Carolina, 1994-1995.
Lorenz Curve, or Accumulative Line Graph
http://ingrimayne.com/econ/AllocatingRationing/MeasuringIncomeDist.html
A Lorenz curve, or Accumulative Line Graph, shows the proportion of the distribution assumed by the bottom "y"% of households. It often compares the % of income (plotted on the y axis) to the % of households (x axis), because it is primarily used in economics. It can also be used to look at assets and general wealth. The Lorenz curve was created in 1905 by Max O. Lorenz, who simply wanted to show the inequalities in the wealth distribution.
This Lorenz curve illustrates the inequalities between percent of income and percent of households.
Stem and leaf plot
http://mainland.cctt.org/mathsummer/JosephBond/StemAndPlots/stem-and-leaf_std.htm
A stem and leaf plot is a way to present numerical data in a graphical format, in order to better visualize distribution. Stem and leaf plots retain the original data to at least two significant digits, and put the data in numerical order. There are two columns (generally) in a stem and leaf plot, that are separated by one vertical line. The stems are on the left, while the leafs are on the right. Stem and leaf plots are useful if plotting relative density and the shape of the data; they are also helpful in finding the mode and any outliers.
This stem and leaf plot shows infant mortality rates in Western Africa.
Similarity Matrix
http://www.biomedcentral.com/1471-2164/8/353/figure/F5?highres=y
A similarity matrix does exactly what its name indicates: it uses colors to show whether (or not) data sets are similar to each other. Typically, darker colors are used to show a higher similarity between variables, while lighter colors are used to show just the opposite.
This similarity matrix shows the similarities between certain genes. Contrast pairs with significant similarity are coded dark red, while pairs with non-significant similarly have no coloring.
Correlation Matrix
http://aesop.rutgers.edu/~lamlab/chromatin/atepigenomics/atepigenomic.html
A corelation matrix assigns specific colors to each cell of the matrix, in an attempt to show a correlation between data sets. By adding color to the matrix, it is easier to see strengths and weaknesses, trends, patterns, etc. Correlation matrices are always symmetric.
This is a correlation matrix (on the right) that predicts the interactions between chromatin modifications through ANCORP analysis.
Parallel Coordinate Graph
http://servus.itn.liu.se/smartdoc/project_results/knowledge/MD-Viewer/summary.html
Parallel coordinate graphs are mainly used to show multivariate data, since they seem to be adapt at accurately conveying multiple sets of data. Each variable is graphed on a respective vertical axis while still exploring the relationship among the variables. This type of graph makes it easy to see trends while examining each individual variable.
The parallel coordinate graph above shows the values among several variables (mpg, weight, horsepower, etc.) that have to do with several vehicles.
Index Value Plot
http://waterwatch.usgs.gov/new/?m=real&r=nc&w=real%2Cplot
An index value plot is a visualization that compares the relativity of all values back to the index value (which is not an absolute value). The index value is plotted on the line graph as a straight line. All other values are thus plotted, and their proximity to the index value is analyzed.
This index value plot shows the average streamflow index for North Carolina for the last 45 days. The data was collected from mid February to the end of March.
Population Profile
http://camellia.shc.edu/literacy/tablesversion/assignments/statisticsassign.htm
A population profile is a chart that shows the number of people in a given city/area/state/country, according to their ages. The ages are often given in ranges of either 5 or 10, depending on the profiler's choice.
Above is the population profile for Mobile County, taken from the 1998 census data.
Triangular Plot
http://www.ex-parrot.com/~chris/wwwitter/20050407-it_doesnt_matter_how_you_vote_either_way_your_planet_is_doomed.html
A triangular plot (also called a ternary plot, ternary graph, or de Finetti diagram) is a barycentric plot on three variables, which all add up to a constant. Graphically, a triangular plot is depicted as an equilateral triangle, with the three points of the triangle representing the three variables. Basically, the proportions of the variables a, b, and c, all must sum to some constant K (which is represented as 1.0 or 100%).
The triangular plot above shows the outcome of a vote between Liberal Democrats, Conservatives, and Labours, due to a recent opinion poll.
Box Plot
http://itl.nist.gov/div898/handbook/eda/section3/boxplot.htm
A box plot (also known as a box-and-whiskers diagram) is a convenient way to categorize numerical data via their five number summaries: the smallest observation (sample minimum), lower quartile (Q1), median (Q2), upper quartile (Q3), and largest observation (sample maximum). Outliers may also be shown on a box plot. Box plots can be featured vertically, or horizontally. Box plots are generally used to show differences in population, but without making any assumptions.
The box plot above compares four machines for energy output.
Histogram
http://en.wikipedia.org/wiki/File:Travel_time_histogram_total_n_Stata.png
In its simplest form, a histogram is a graphical representation of a distribution of data. A histogram consists of tabular frequencies, shown as side-by-side rectangles, displayed over a range of intervals. The intervals are usually ranges (as previously stated), generally the same size, and must be adjacent. Histograms are most often used to plot density of data.
The histogram above shows the United States' 2000 census of travel time.
Climograph
http://www.uwsp.edu/geo/faculty/ritter/glossary/A_D/climograph.html
A climograph is a graphical juxtaposition of the monthly precipitation, compared to the temperature, for a specific place for the time period of one year. Precipitation is represented by a bar graph, while temperature is represented by a line graph. It is a quick and easy way to visualize the climate for a particular location.
The climograph above shows the 2006 contrast between precipitation and temperature for Memphis, TN.
Windrose Map
http://en.wikipedia.org/wiki/File:Wind_rose_plot.jpg
A windrose is a tool primarily used by meteorologists to see how wind-speed and direction are being distributed at a particular location. Meteorologists analyze the frequency of winds over a long period of time. They then use a polar coordinate system of gridding to plot it against wind direction; color bands depict different wind ranges. The directions of the rose (the combination of all of the "roses" is the windrose) with the longest spoke shows the wind direction with the greatest frequency.
The windrose map shown above shows the Windrose plot (Station #14732) at LaGuardia Airport, New York, New York.
Range Graded Proportional Circle Map
http://pubs.usgs.gov/fs/fs-004-03/
A range graded proportional circle map is a proportional circle map in which the data are divided into groups, using classification methods common to choropleth mapping. The cartographer chooses symbol sizes for the different classes so that the map reader can easily identify different circle sizes, and thus, categories of the data being examined. This type of circle map deals with more than one type of data.
The range graded proportional circle map shown above features the river characteristics, according to the notes found in Lewis and Clark's journal(s). The areas of the circles are proportional to the river/channel width.
Continuously Variable Proportional Circle Map
Continuously Variable Proportional Circle Maps are like Proportional Circle Maps, in the sense that they both use different sized circles to display different data sets. However, continuously variable proportional circle maps take it another, more detailed step, by putting pie charts within each individual circle. This measures even more variables, perhaps by measuring the variables within the variables, or the frequency of the original variable that is represented by all the circles.
The map above shows major industries in different parts of Germany. The size of the circle represents how small or large that area's industry is, and the different colors within the circle correspond to a particular type of industry.
Bilateral Graph
http://www.rba.gov.au/publications/bulletin/2008/feb/1.html
A bilateral graph is a visualization map that depicts increases on one side of the zero line, and decreases on the other side of the zero line. Basically, a bilateral graph is used to display any relationship between positive and negative data values.
The bilateral graph above shows the Nominal TWI and ATWI for the National Reserve Bank of Australia.
Isopleth Map
http://www.globalchange.umich.edu/globalchange1/current/lectures/kling/water_nitro/water_nitro.html
Isopleth maps generalize and simplify data with a continuous distribution. The data is shown via series of lines called isopleths, which connect points of equal value. These isopleths generally represent things like surface elevation, amounts of precipitation, atmospheric pressure, etc., because isopleth maps generally show data as 3-dimensional. Isopleths never cross or divide, and they always form enclosed circles.
This isopleth map shows the varying level of sensitivity to acid rain in the United States.
Isopach Map
http://www.glossary.oilfield.slb.com/DisplayImage.cfm?ID=114
An isopach map is a map that contains many isopachs. Isopachs are contour lines of equal thickness over an area, and, put together, they show the variation of thickness within a tabular unit or stratum. Isopach maps are used for stratigraphy, sedimentology, structural/petroleum geology, and volcanology.
This isopach map depicts isopachs of a reservoir, with contours shown in red dashes (source: Venezuela Well Evaluation Conference, 1997).
Isohyet Map
http://www.scoop.co.nz/stories/AK0808/S00090.htm
Isohyets are lines on a map that connect points that receive equal areas of precipitation over a given period of time. Like isobars and isotachs, isohyets are very useful when looking at weather patterns and upcoming forecasts. High isohyets will alert meteorologists of high rainfall, and this knowledge will help people plan ahead when looking at their local weather forecasts.
The isohyet map shown above depicts this month's rainfall for the North Island of New Zealand.
Isotachs
http://www4.ncsu.edu/~nwsfo/storage/cases/20030123/
Isotachs are lines in any given surface that connect points with equal wind speed. Like isobar maps, these are helpful in determining atmospheric and/or weather conditions. Any abnormalities in the isotachs can indicate the potential of having severe weather (i.e, tornados).
The isotach map shown above uses different colors to show equal - and different - areas of wind speed.
Isobar Map
The isobar map above depicts the current forecast analysis for Europe.
LIDAR
http://imaging.geocomm.com/gallery/
LIDAR, also known as Light Detection and Ranging (or LADAR, but that is primary for military purposes), is an optical remote sensing technology. It measures properties of a target (i.e., the distance to that target) by illuminating the target with light (ultraviolet, visible, or near infrared light), often using pulses from a laser. LIDAR technology has many uses: archaeology, geography, geology, seismology, forestry, and atmospheric physics. LIDARS are particularly used for geographical-related purposes in the following instance: LIDAR can detect subtle topographic features, like river terraces, and measure land surface elevation.
The LIDAR map above shows Ground Zero in NYC, rendered on September 27th of 2001.
Doppler Radar
http://oceanservice.noaa.gov/education/yos/resource/JetStream/doppler/baserefl.htm
A Doppler radar is a specialized radar that utilizes the doppler effect in order to produce velocity data, regarding objects at a considerable distance. This is done by beaming microwave signals towards the desired target, and then listening for its reflection. The frequency of the returned signal is analyzed, and how the sound has been altered by the object's motion is particularly noted. The variation in frequency gives a direct and highly accurate measurement of the target velocity relative to the radar. This is seen and used in weather all of the time - weather forecasters toss the phrase 'doppler radar' around so much that it has become synonymous with meteorology. However, Doppler radar has a wide variety of uses: aviation, police speed guns, radiology, etc.
The map above shows the Doppler Radar of Frederick, Ohio (in center).
Infrared Aerial Photo Map
http://sofia.usgs.gov/publications/fs/2004-3016/
Infrared Aerial Photography is a type of map because of how powerful of a tool it is. Infrared's film and infrared digital sensors are so sensitive to a certain portion of the light spectrum, that they can provide very useful information (after careful filtration, processing/selection of films, etc.). These photos can be used to document changes to the environment (i.e., the health of forests, the Everglades, any bodies of water), but can also be used for more detail oriented jobs, like observing damages to roofs, or detecting where toxic chemicals are on land.
The infrared aerial photo above shows the southern Florida peninsula.
DOQQ
http://www.lib.ncsu.edu/gis/doqq.html
DOQQs (Digital Orthophoto Quarter Quads) are digital aerial images produced by the USGS. These are geometrically corrected so that the scale is uniform: since it has the same lack of distortion of a map, it can be used to measure true distances. DOQQs are commonly used while creating GIS programs and softwares.
The DOQQ shown above is a color infared from 1998, showing part of Flowers, NE.
Cartographic Animation
http://www.blacksworld.net/blog/2007/08/
Cartographic animation's main goal is to depict change. The types of these changes are either categorized as temporal, or non-temporal. Most cartographic animations depict change over time (temporal). While non-temporal cartographic animations are rare, they are possible. Geographical areas are generally represented, while a factor (i.e., geospatial data, location, etc.) is contrasted with time.
The cartographic animation above shows the frequencies of traffic accidents in the United States, placed according to their actual locations.
Statistical Map
http://personalpages.manchester.ac.uk/staff/m.dodge/cybergeography/atlas/census.html
Statistical maps are maps that simply specialize in conveying specific ranges of accurate data. The variation in quantity of a factor is indicated, and this factor is numerical. Several types of maps can be statistical: dot maps, choropleth maps, etc. What matters is the information on the map, not what type of map it is. This numerical information can take many forms: rainfall, population, crops, etc.
The statistical map shown above features the growth rates in Africa from July 1995 to July of 1996. The information is depicted linearly, and colors are used to indicate ranges of change (in percentages).
Cartogram
http://cscs.umich.edu/~crshalizi/election/
A cartogram is a map that depicts some thematic mapping variable (i.e, travel time, Gross National/Domestic Product, etc.), instead of land area or distance. The original geometry and space associated with the geological features is thus distorted to properly convey the new variable's information. There are two types of cartograms: area and distance cartograms. Area cartograms are generally used to map things like population, while distance cartograms are used more for relative travel times and directions.
The cartogram above distorted the shape of the United States to depict the 2004 presidential election results by party (Democratic or Republican).
Flow Map
http://www.mundi.net/maps/maps_014/
Flow maps are "a mix of maps and flowcharts, that show the movement of objects from one location to another," (Doantam Phan, Stanford University). They depict things like the number of people in a migration, the amount of goods being traded, or the number of packets in a network. They can basically be utilized to show the movement of almost anything imaginable, whether it be abstract or concrete. Things that can be shown on the maps are the direction what the variable is, where variable is moving, how much of the variable there is moving, and other general information.
The flow map featured above shows telecommunications traffic in Europe.
Isoline Map
http://lostmanmaps.com/gallery.html
An isoline map is one with continuous lines that join points of the same value together. The most common type of isoline map is one that shows lines that indicate equal elevation (a contour map). Other isoline maps feature different variables: temperature (called isotherms); barometric pressure (isobars); wind speed (isotachs); and wind direction (isogons), etc.
The isoline map shown above shows annual rainfall for the state of Washington in 1996.
Proportional circle map
http://geographyfieldwork.com/DataPresentationMappingTechniques.htm
A proportional circle map displays its data by solely using circles as symbols. The bigger the circle, the more of that variable; inversely, the smaller the circle, the less of that variable/factor. Basically, the amount of data being studied depends on the sizes of the circles on the map.
The proportional circle map shown above represents the voting registry for the Czech Republic.
Choropleth Map
http://en.wikipedia.org/wiki/File:2004US_election_map.svg
A choropleth map (coming from the Greek words "area/region" and "multiply") is a thematic map, in which areas are shaded or patterned via certain color patterns. These represent the measurements of whatever variable is being displayed on the map (i.e, population density, per-capita income, etc.). The choropleth map is an easy way to visualize how measurements can vary across big - or small - geographic areas (i.e, the whole United States). It can also show how much a factor varies within a particular region, country, state, etc. Color progressions include single-hue, bi-polar, partial spectral, blended hue, value, and full spectral color progression.
The choropleth map shown above features the voter percentage difference in the 2004 presidential election.
Dot Distribution Map
http://www.birds.cornell.edu/pfw_fr/Members/ParticipantMap00.htm
A dot distribution map - or dot density map - uses a dot symbol to illustrate certain features of phenomena. Dot maps ultimately rely on certain clusters and scatters to show any sort of visual pattern. Historical dot distribution maps include Fransican monk's Montizon's map that depicts the different administrative districts in France, and John Snow of England's outbreak of cholera map.
The dot distribution map above shows where FeederWatch participants counted birds in the 2000-2001 bird season.
Propaganda Map
http://www.historum.com/general-history/9905-propaganda-maps.html
Propaganda maps are generally posters or pictures that are used to send a strong political message. These are used in times of war and need, and try to capture the public's attention, and sway their opinion. All maps are actually political in some sense, because they reflect the interest of their producers. Map-makers can use scale or distortion to their advantage(s), and leave data or geological features out. However, maps that depict symbols or other words can be branded as posters, and these act in a manner that is favorable to one position, and often against (or defaming the name of) another position. Propaganda is ultimately used to obtain power, and a map is simply another tool for doing so.
The propaganda map shown above is a Japanese representation of the Russian control during the 1905 Russo-Japanese War. The Russians are depicted as the "Black Octopus", with incredibly forceful and violent tentacles. This map-maker was clearly trying to gain the rest of the country's - or the outside world's - sympathy.
Hypsometric Map
http://www.aralmodel.unesco.kz/ch_2_e.htm
Hypsometric maps represent the elevation of the terrain by using colors. They utilize specific tints, with each tint representing the area between two neighboring contour lines. Ranges of elevation are usually depicted as bands of color (hence, tints). This color method is most common in topographic maps with small scales, as continuous gradients or intervals. The order of the colors tends to depend on the different sets of rules used for such maps.
The hypsometric map shown above is of the Eastern Priaralye.
Star plots
http://www.itl.nist.gov/div898/handbook/eda/section3/starplot.htm
The star plot's main purpose is to display multivariate data (and best represents small-medium data sets). Each star acts as a single observation, and represents one factor. Star plots are useful in determining things like if there are any outliers, if there are any domination observations, and which observations are most similar.
The star plot shown above is of 16 cars, sorted by factors like mileage, price, weight, head room, etc., for the year 1979.
DLG Map
http://www.dnr.sc.gov/GIS/descdlg.html
A digital line graph (DLG) map are data files that contain vector representations of cartographic information, derived from USGS maps and related sources. It's use of bright and distinct colors, and precise lines only help its reader in identifying key geological features, like streets, buildings, utility lines, etc. They include information from the USGS planimetric map base categories such as transportation, contours, and PLSS boundaries.
The DLG shown above is of Beaufort, South Carolina.
DRG Map
https://www.e-education.psu.edu/natureofgeoinfo/c6_p6.html
A digital raster graphic (DRG) is a scanned image of the U.S. Geological Survey (USGS) standard series topographic map. These maps include all map collar information. The map "neatline" is then geo-referenced to the surface of the Earth, and the DRG map is thus used to collect, review, and revise other digital data. Combining DRG maps with other types (DEMs, DOQQs, etc.) only helps, by providing additional visual cartographic information.
This DRG is a magnified portion of a separate DRG map of Bushkill, PA.
DEM Map
http://www.satimagingcorp.com/gallery/dem-sahara-tunisia-lg.html
DEM maps, also known as Digital Elevation Models, are usually 3-dimensional (3-D) representations of the terrain's surface. Maps are created using terrain elevation model data, and these maps usually feature the Earth's surface, a moon, or an asteroid. This map can be illustrated in two ways: raster (grids of equal size/shape squares), or in a network of irregular triangles. DEMs, while commonly built using remote sensing, can also be built using land surveying. DEMs are also required for many technical skills: these maps are used for anything from GIS/GPS, to base mapping and flight simulation.
The DEM map showed above is of the Sahara Desert, and was extracted from Stereo IKONOS Satellite Image data at 0.8m resolution.
Black & White Aerial Photo Map
http://isaacalongi.com/kansas-city-aerial-photography/
Black and white aerial photos are used as a type of map, both recreationally and for governmentally purposes. As opposed to using color photography, putting everything in black and white creates a sharper image, allowing differences (over time) to be more easily seen. These images are usually produced for government agencies, to use for GIS (geographic informational systems) - they also can be used as a sort of map recreationally, by professional photographs who wish to highlight a specific area or landmark.
This black and white aerial photo is of downtown Kansas City.
PLSS Map
http://nationalatlas.gov/articles/boundaries/a_plss.html
The Public Land Survey System (PLSS) was developed by Thomas Jefferson shortly after the American Revolution, and first put into action with the Land Ordinance of 1785. Now, this method is used by the United States to survey and identify parcels of land. This is done primarily to establish titles and deeds for rural, wild, and/or undeveloped land. While it was first enacted using the British system of metes-and-bounds, PLSS maps now measure using townships and sections. Baselines (which run east-west) and meridians (which run north-south), are further utilized to be as exact as possible.
The PLSS map shown above features the Principal Meridians and Baselines for the United States, and is provided by the Bureau of Land Management.
Cadastral Map
http://www.shtetlinks.jewishgen.org/Brody/sherins_cadastral_map1.2.html
A cadastral map shows the boundaries and ownership of land parcels; i.e, how big the piece of property is (length x width), and who owns it. Detailed information is also provided: survey district names, numbers that identify respective plots of land, street names, etc. This concept comes from the word/system "cadastre", in which cadastral maps and surveys are used to form a register of the metes-and-bounds property of a country. Cadasters, which are used around the world, contain a wide variety of information: the ownership, the value of the land, the dimensions (and area), tax rates, zoning areas, etc. Cadasters (and thus cadastral maps) are maintained by the government, and are public information, available to any and everyone.
This is a cadastral map of Brody, Austria-Galicia, in 1844.
Thematic Map
http://www.elderweb.com/node/2867
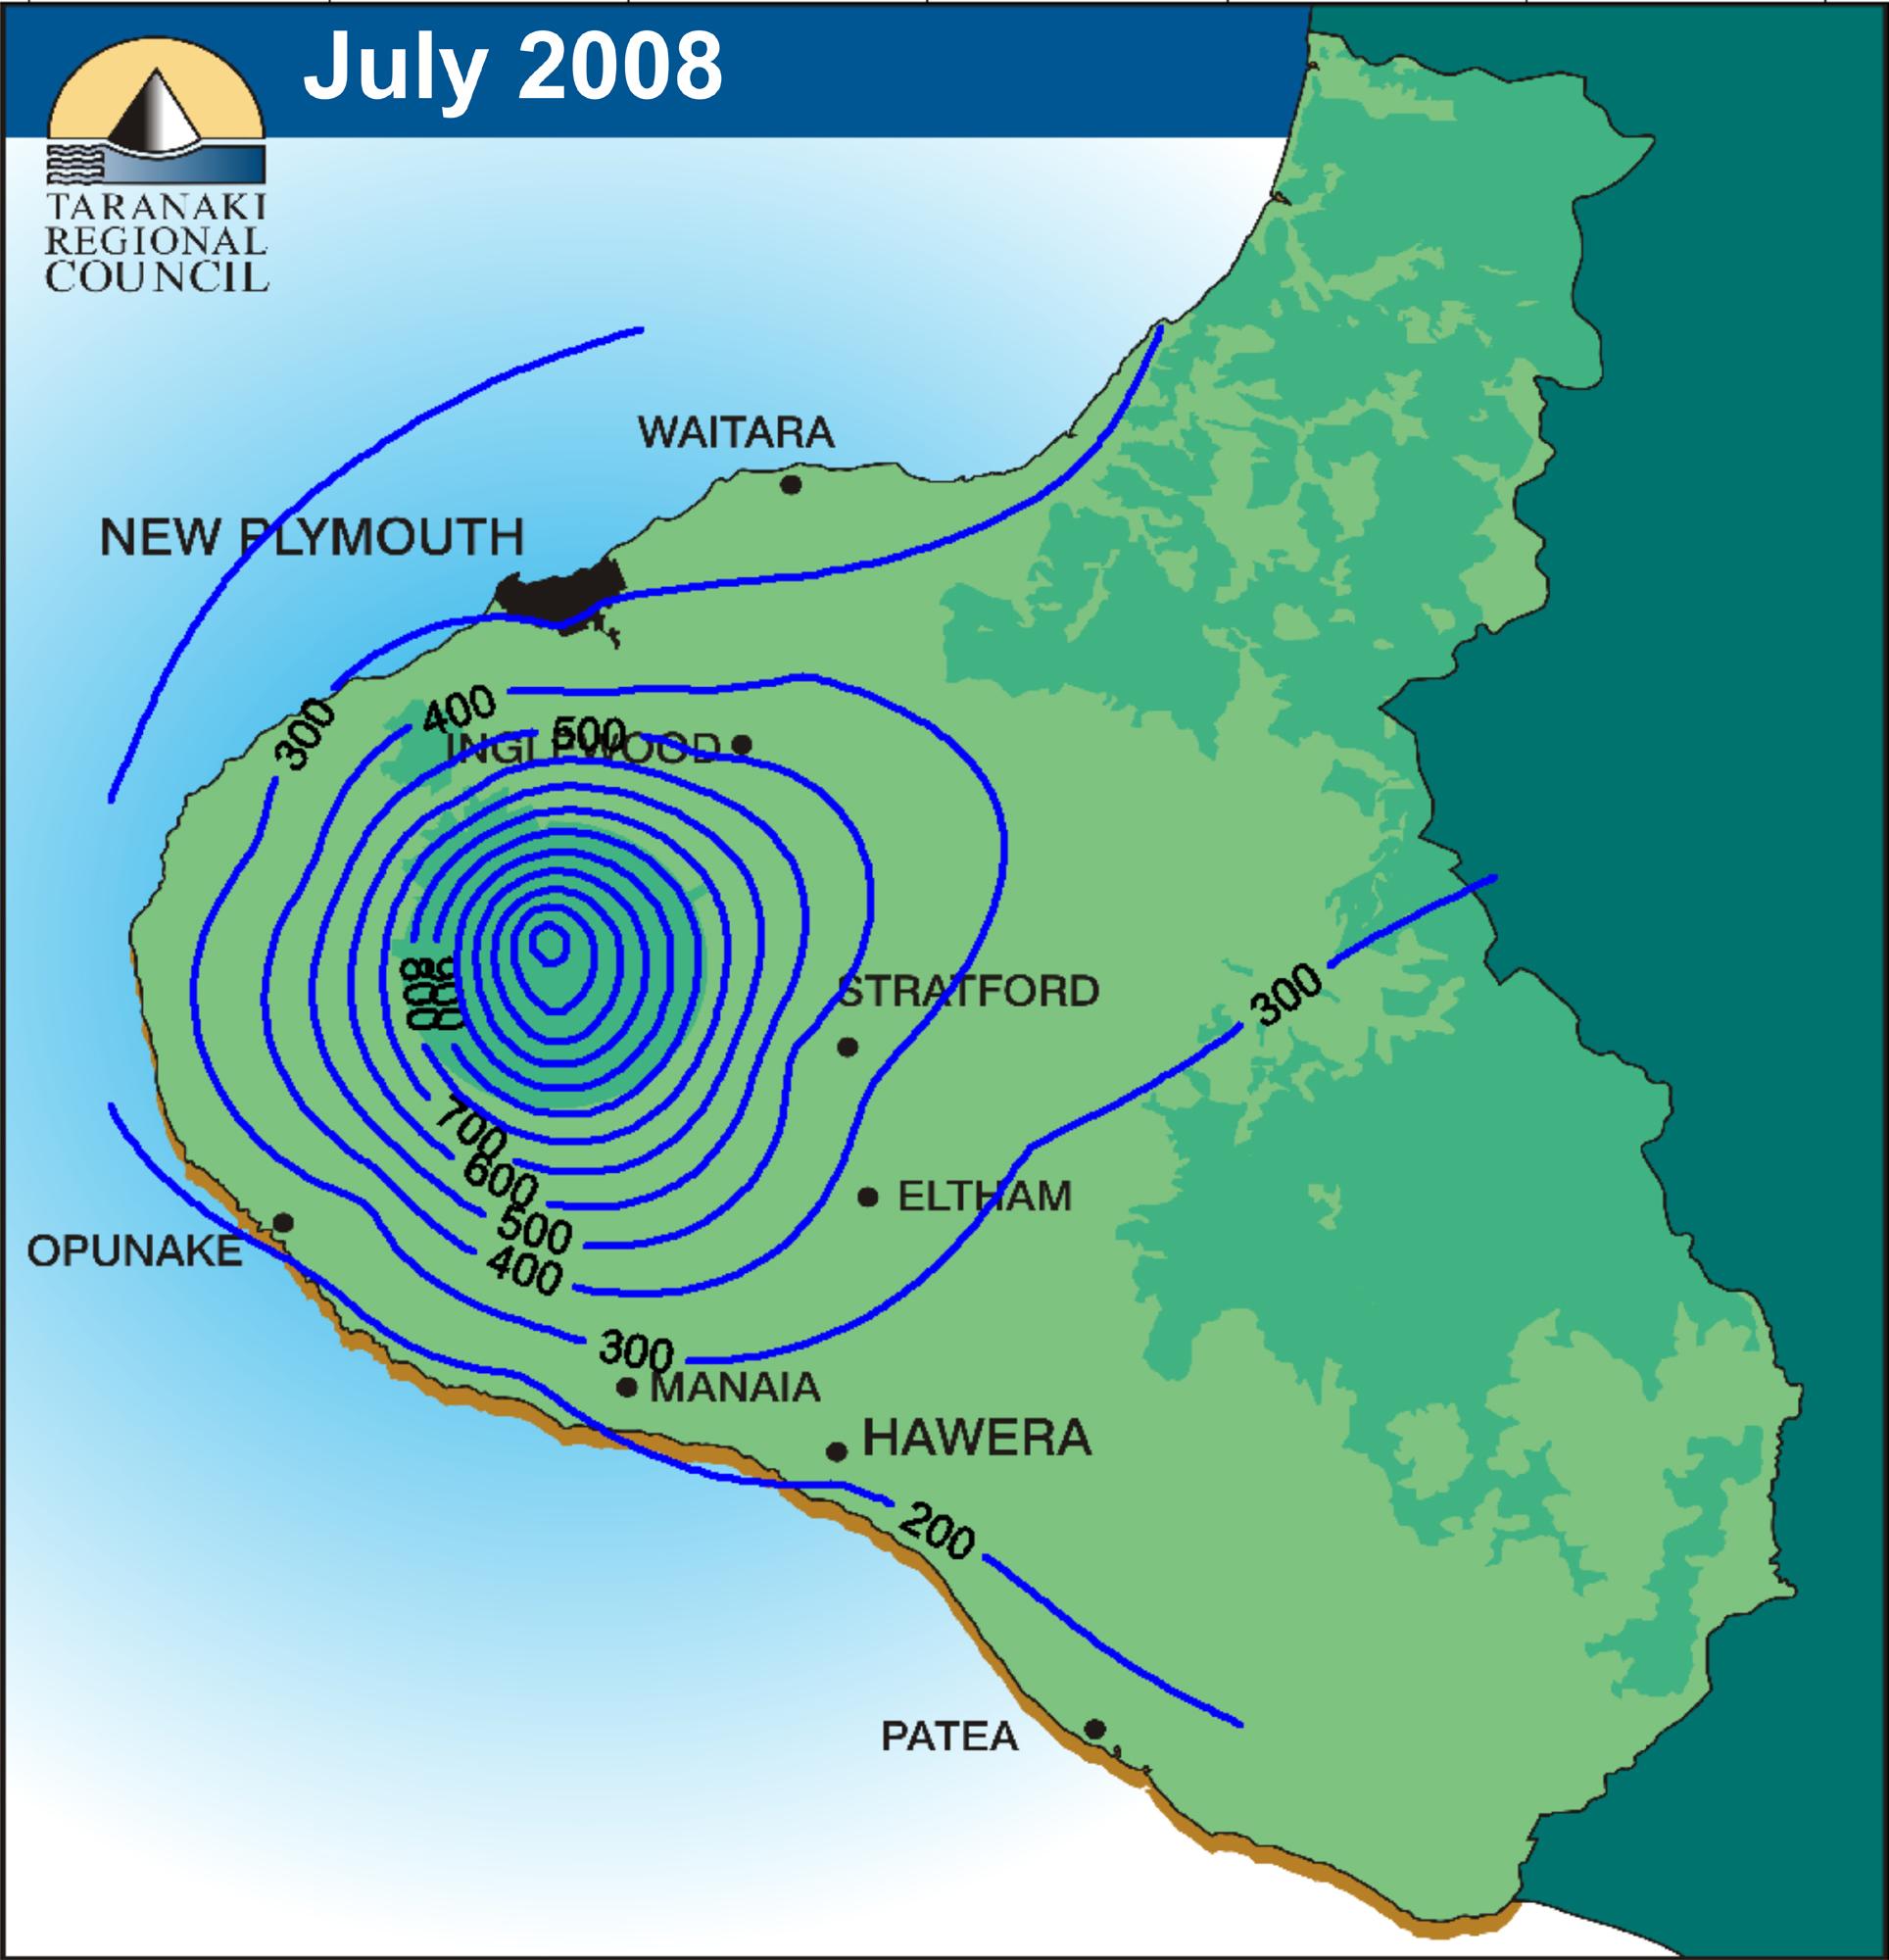
Thematic maps purposefully relate a particular concept or idea (hence, theme) to a specific geographical location. According to the Map Collection & Cartographic Information Services Unit at the University of Washington, thematic maps "can portray physical, social, political, cultural, economic, sociological, agricultural, or any other aspects of a city, state, region, nation, or continent". While a normal map can tie in several concepts at once - i.e, maps that show gerrymandering tie in geographical, locational, and political concepts - thematic maps tend to focus on just one idea or theme. Thematic maps have a variety of uses. For example, they can provide specific information about a particular location, or they can show spatial trends over time regarding certain themes (weather, politics, census, etc.)
The thematic map above shows the Percentage of Households with Individuals 65 and Over for the State of Florida. This information was retrieved from the 2000 census, and is sorted by county.
Topographic Map
http://en.wikipedia.org/wiki/File:IsraelCVFRtopography.jpg
Topographic maps are generally recognized by their use of contour lines, which are two line segments that connect, often representing elevation on topographic maps. They are characterized by large-scale detail and relief, thus having a tendency to show natural and man-made features. Topographic maps can be considered complex in the sense that that each single 'map' is really a section - a part of the greater picture. These sections, called map sheets, are pieced together to form the whole map. Topographic maps are often defined by what they are not - they are distinct from planimetric maps because they show vertical features (i.e, elevation); and they are distinct from thematic maps because they focus on the bigger picture, rather than a specific topic. Generally, a map is considered topographic if it accurately displays cultural and natural features, and is detail oriented.
The topographic map featured on this post is from Wikipedia (8 October 2008), and shows a section of the Nablus area (West Bank), with contour lines at 100-m intervals.
Planimetric Map
http://www.uwsp.edu/geo/projects/geoweb/participants/dutch/VTrips/Charlevoix.HTM
A planimetric map shows only the horizontal position of features on the Earth's surface, by using lines and symbols. Geographic objects, natural and cultural physical features, and entities that do not have topographic features (i.e, buildings, streets, bodies of water, etc.) are showcased in these maps. Vertical lines and features - like elevation - are purposefully ignored. Planimetric maps are also known as line maps.
The planimetric map featured here is a location map of Quebec City and the Charlevoix Impact Structure, circa 1999.
Thursday, July 14, 2011
Mental Map
http://www.fedstats.gov/kids/mapstats/concepts_mentalmaps.html
The map shown is a mental map, in which a person's specific point-of-view perception of a particular concrete or abstract concept is depicted. Every person's "mental map" (also called a "mind map", which ultimately comes from the idea of conceptual mapping) is unique to them; no one has the same mental map. The possibilities of what could be shown on a mental map are endless: everything from the continents, to neighborhoods, to internet sites could be shown on a mental map. For example, a kindergartener's visual of the Earth & it's continents will be different/not as exact as a high schooler's; similarly, an idea of what the internet looks like to a high schooler (i.e, Facebook, Tumblr, e-mail, etc.) will be different than an elderly person's. Simply put, a mental map is a physical representation of a specific visual that originated inside someone's brain/mind.
The mental map depicted above shows someone's view of what the Nottingham City Centre looked like in 1997.
Subscribe to:
Posts (Atom)